+1 (301) 200-2077
Learn how to evaluate building performance across IAQ, energy, and HVAC systems for operational excellence.
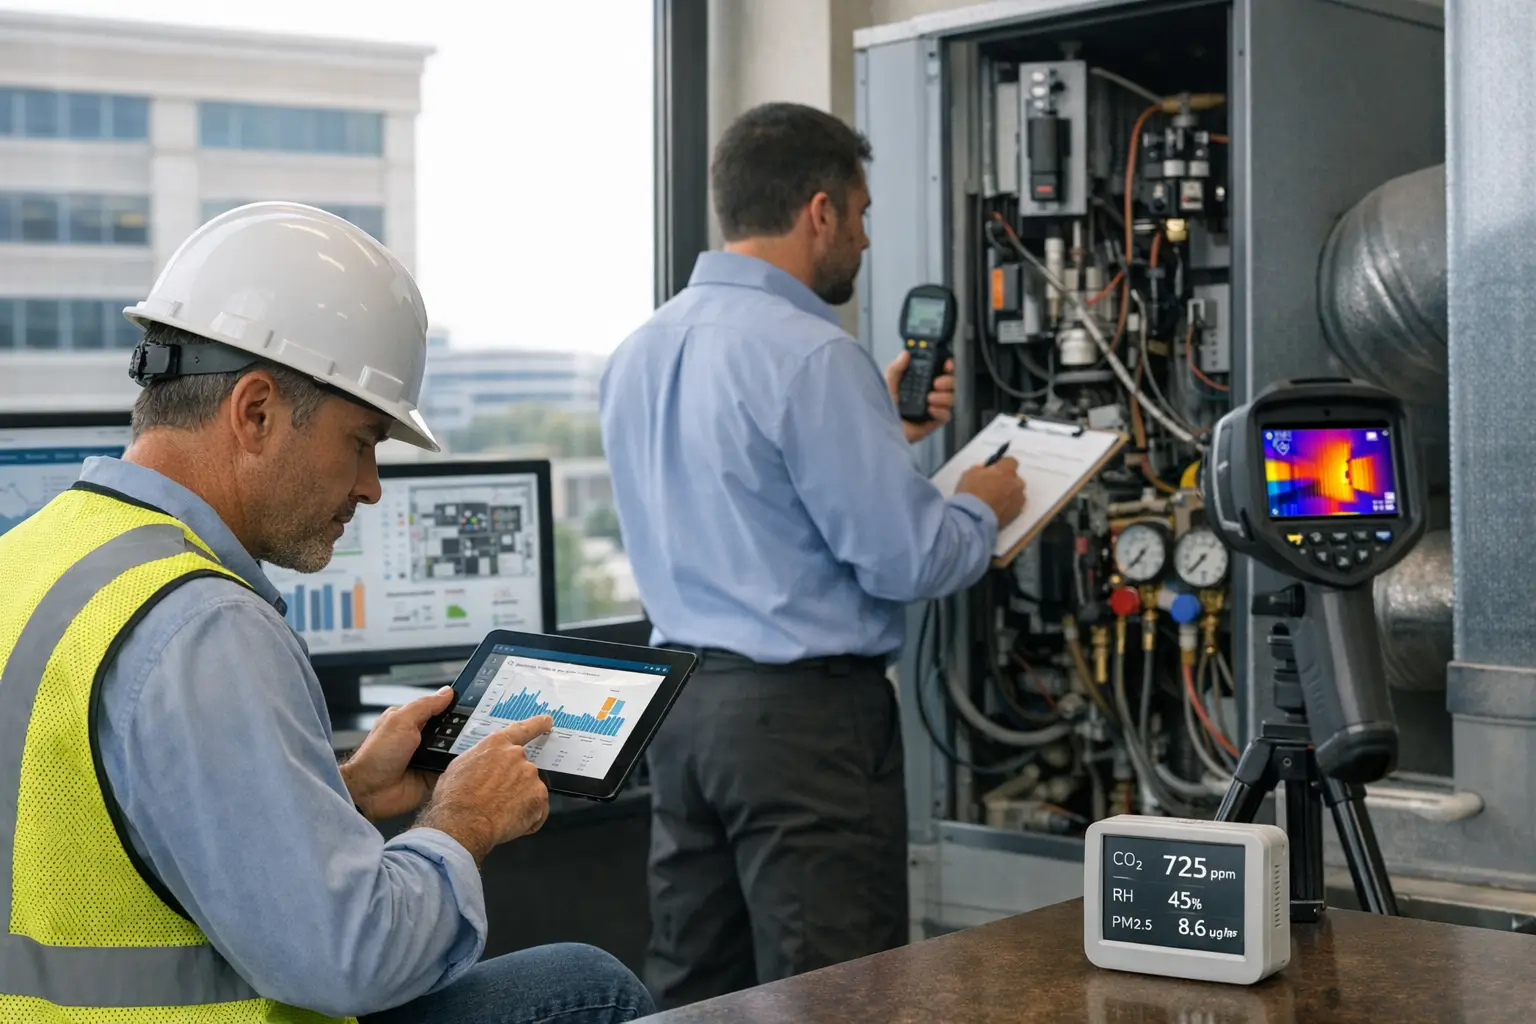
A Practical Framework for Facility Managers & Building Owners
Prepared by Zytona — Building Performance & Commissioning Specialists
Every meaningful building improvement initiative begins with the same question: Where do we stand today? Without a clear, data-driven understanding of current performance, facility managers and building owners operate in the dark—making decisions based on assumptions, vendor recommendations, or the loudest complaint rather than objective evidence.
Building performance assessment provides the diagnostic foundation that transforms reactive management into strategic investment. Consider the financial implications: buildings operating reactively typically spend 30–50% more on maintenance than those with proactive programs, according to research published by the National Institute of Building Sciences. Emergency repairs cost three to five times more than planned maintenance. Undetected energy waste compounds monthly, often representing 15–30% of utility costs in buildings that have never undergone systematic assessment.
Beyond cost, assessment reveals comfort problems before they drive tenant complaints, identifies code compliance gaps before they trigger violations, and documents equipment conditions before catastrophic failures disrupt operations. The assessment process itself creates accountability—establishing baselines against which future improvements can be measured and verified.
This guide provides a structured framework for conducting comprehensive building performance assessments. Whether you manage a single facility or a portfolio of properties, these protocols will help you identify opportunities, prioritize investments, and build the business case for improvement projects that deliver measurable results.
Accurate energy assessment begins with data collection. Gather complete utility records covering a minimum of 12 months, though 24 months provides better insight into year-over-year patterns and helps distinguish anomalies from trends. Collect the following for each meter serving the building:
Request data directly from utilities when historical records are incomplete. Most utilities provide 24 months of history through online portals or upon written request.
Energy Use Intensity (EUI) normalizes consumption by building size, enabling comparison across facilities and against benchmarks. Calculate site EUI using this formula:
Site EUI = Total Annual Energy (kBtu) ÷ Gross Floor Area (square feet)
Convert electricity to kBtu by multiplying kWh by 3.412. Convert natural gas therms to kBtu by multiplying by 100. For reference, the Commercial Buildings Energy Consumption Survey (CBECS) published by the U.S. Energy Information Administration reports median site EUI values by building type: office buildings average 79.5 kBtu/sf, healthcare facilities average 192.2 kBtu/sf, and retail buildings average 52.6 kBtu/sf.
Portfolio Manager, maintained by the U.S. Environmental Protection Agency, remains the industry standard for building energy benchmarking. Setup requires these steps:
Peak Demand: The highest 15-minute average power draw during a billing period. High peak demand relative to average consumption suggests equipment simultaneously cycling, poor load sequencing, or demand spikes from specific processes.
Load Factor: Calculate as (Total kWh ÷ Hours in Period) ÷ Peak Demand. Values below 0.40 indicate poor load management. Values above 0.60 suggest efficient, consistent operation.
Demand Profile Shape: Interval data reveals whether consumption patterns match occupancy. Buildings showing flat 24-hour profiles despite scheduled occupancy have systems running unnecessarily during unoccupied periods.
When interval data is available, analyze for these patterns:
Begin with a complete inventory of HVAC equipment. For each major component, document:
Compare equipment age against median service life data published by ASHRAE. Chillers typically serve 20–25 years, rooftop units 15–20 years, boilers 25–35 years, and variable frequency drives 15–20 years. Equipment approaching or exceeding median life requires closer scrutiny and contingency planning.
Extract trends from the building automation system covering the past 6–12 months. Focus on:
Runtime Analysis: Compare actual equipment runtime against scheduled occupancy. Systems running 24/7 when scheduled for 12 hours indicate override conditions or scheduling errors. Calculate runtime percentage as (actual hours ÷ scheduled hours) × 100.
Setpoint Tracking: Plot actual temperature versus setpoint over time. Consistent deviation in one direction indicates capacity problems. Hunting around setpoint indicates control tuning issues.
Alarm History: Categorize alarms by system and frequency. Recurring alarms indicate unresolved underlying problems. High-priority alarms without documented response indicate maintenance gaps.
Physical inspection reveals conditions not captured by automated monitoring. Check these ten items during walkthrough:
Locate the most recent Testing, Adjusting, and Balancing (TAB) report. Confirm airflows and water flows match design requirements. Compare current conditions against documented values:
Buildings without TAB documentation or those more than ten years since last balancing typically benefit from rebalancing services.
Evaluate the building automation system’s capability and utilization:
Comprehensive indoor air quality assessment includes these parameters:
Carbon Dioxide (CO2): Primary indicator of ventilation adequacy. ASHRAE Standard 62.1 calculations typically result in indoor concentrations 500–700 ppm above outdoor levels when ventilation meets requirements. Concentrations exceeding 1,000 ppm above outdoor baseline suggest inadequate outdoor air delivery.
Temperature: ASHRAE Standard 55 defines comfort ranges. For typical office conditions with sedentary activity and standard clothing, acceptable operative temperatures range from 68°F to 76°F in winter and 73°F to 79°F in summer.
Relative Humidity: ASHRAE recommends maintaining below 65% to limit microbial growth. Levels below 30% cause discomfort and increase static electricity. Target range is 30–60%.
Carbon Monoxide (CO): Indicates combustion byproduct infiltration or parking garage air migration. Concentrations should remain below 9 ppm as an 8-hour average per EPA National Ambient Air Quality Standards.
Particulate Matter (PM2.5): Indicates filtration effectiveness and outdoor air quality. EPA recommends indoor levels below 12 µg/m³ annual average, with 35 µg/m³ as a 24-hour limit.
Total Volatile Organic Compounds (TVOCs): Indicates off-gassing from furnishings, cleaning products, and building materials. While no regulatory indoor standard exists, levels below 300 µg/m³ are generally considered acceptable.
Portable Instruments: Handheld multi-parameter monitors provide spot measurements during assessment. Advantages include lower cost, flexibility to measure multiple locations, and no installation requirements. Limitations include capturing only point-in-time conditions and requiring manual data recording.
Permanent Monitoring: Networked sensors provide continuous data, revealing patterns across occupancy cycles and seasons. Systems like those certified under the RESET Air standard provide verified accuracy. Installation costs are higher but ongoing operational insight justifies investment in spaces with documented IAQ concerns or high-value occupancy.
Review outdoor air delivery against ASHRAE 62.1-2022 requirements:
Supplement measurement data with occupant perception surveys. The Center for the Built Environment at UC Berkeley provides validated survey instruments for this purpose. Key practices include:
Comprehensive commissioning generates specific deliverables. Audit project records for these documents:
Owner’s Project Requirements (OPR): Defines the owner’s expectations for building performance, function, and operation. This document forms the basis for all commissioning verification.
Basis of Design (BOD): Documents how design decisions address OPR requirements. Links design intent to testable outcomes.
Commissioning Plan: Describes scope, schedule, roles, and specific testing procedures. Should include checklists for each system.
Commissioning Report: Documents all testing, results, and resolution of identified deficiencies. Should include functional test procedures with actual results annotated.
Buildings constructed to LEED certification requirements after 2005 should have these documents. Absence suggests either non-commissioned construction or poor record retention.
Select representative systems and reverify commissioning test results:
Performance drift is normal over time. Systems typically require recommissioning every three to five years to maintain original performance levels.